In my last blog entry I found that the Ryzen CPUs consume significantly more power than they report via the usual software. Several internally and externally generated power nets seem have no reprensentation in software. I also supected power counters for these additional planes might actually exist in hardware but are just not exposed by the sofware. For whatever reason that might be. As it turns out: Yes, there are more power counters. A LOT more.
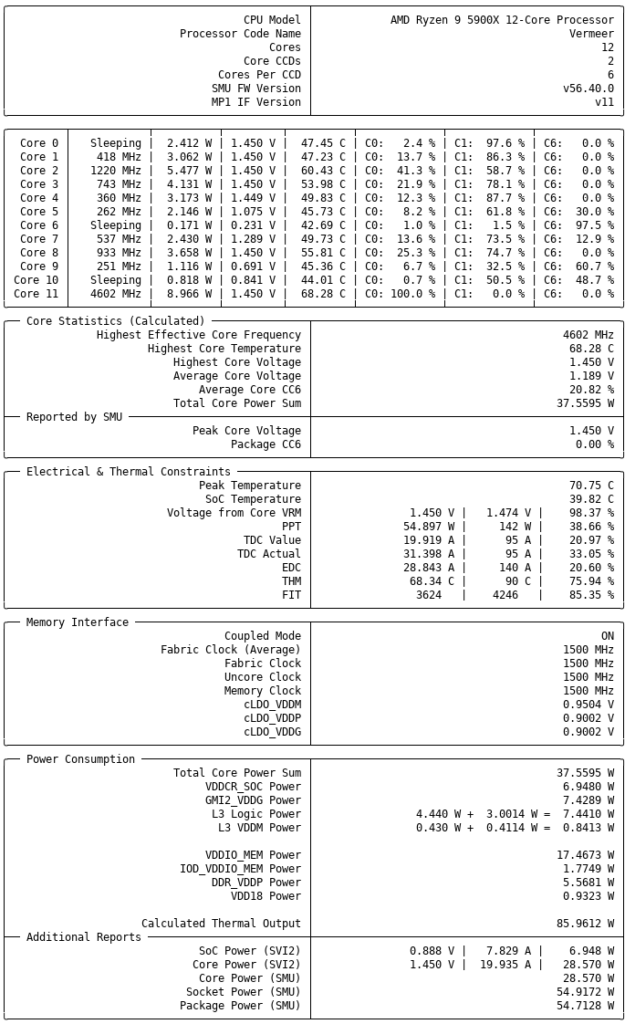
Thanks to a project which reverse engineers the communication between the CPU and SMU I was able the extract and reverse engineer the PM table for the Ryzen 5000 processors. Here is a screenshot of the CPU performance monitor tool I created:

I will talk more about this tool in my next blog entry. Also I submitted patches to the corresponding projects.
Actual measurement vs. software power counters
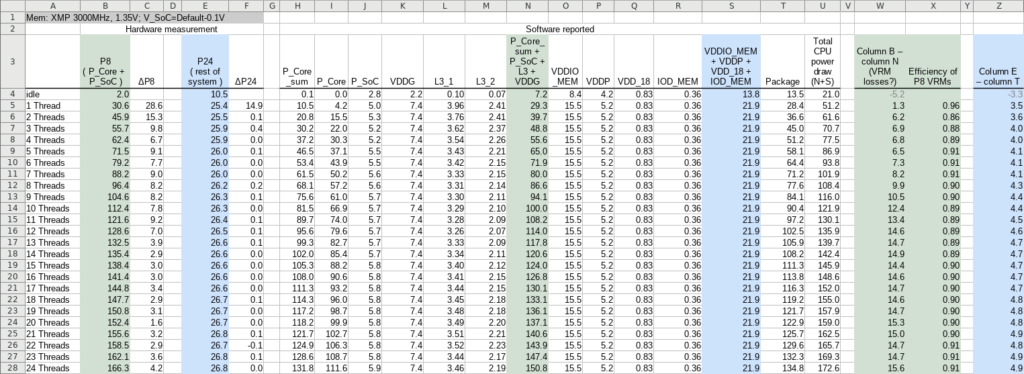
Let’s use the values we now can access and create a new comparison bewteen actual hardware measurement and what we can pull out of the software:

The left green column (B) is the power drawn from the 8 pin CPU power header of the mainboard. It contains the P_Core and P_SoC power as well as the losses from the corresponding VRMs. The green column in the center (N) sums up the software reported measurements to its left. It is notable, that the P_Core reported by the PM table of the SMU (column (I), identical to what HWiNFO displays) is much less than the sum of all powers the individual cores report (P_Core_sum, column (H); compare with picture of my disgnostic software from above).
The sum in the green center column (N) therfore uses P_Core_sum (H) instead of P_Core (I). As you can see, that way it is actually pretty close to the actual measurement on the left (B). The right green column (W) finally gives the difference between the software sum (N) and the actual mesurement (B). The remaining difference covers the losses inside the VRMs. 15W at full load roughly match the thermal output of the VRMs. Also, about 90% is a resonable efficiency for this type of buck converter, so that seems all right.
The blue columns work in the same way: (E) gives the actual power draw, (T) is the sum of all sofware counters I found for power planes derived from P24 and (Y) is the difference. The difference includes about 2.3W for the B550 chipset. That leaves another 2W for miscellaneous chips, which seems plausible.
Package power vs. actual power consumption
The package power of column (T) is also given in HWiNFO and is identical to the TTP value reported in the official Ryzen Master software. However, the actual power consumption of the CPU, and thus also the actual thermal output (U) is significantly higher: It is the sum of columns (N) and (S). Under full load the actual thermal power output is ~38W higher than the reported package power! (That’s +28 %.) For a 2 thread load the true power is ~62W, while the package power and TTP report only 36.6W. (+68% of reported value!)
It remains unclear, why just exactly that software that most likely will get used by the usual influencers and test reports (i.e. HWiNFO and Ryzen Master) only shows a select part of the actual power draw and by that makes the CPU look much more efficient than it really is. This is especially true for low loads (i.e. office & web browsing).
Anyway, at least under Linux we now have access to much more information and can understand the behaviour of the system better. Unfortunately, the Ryzen 5000 scales much worse under low load than what I’m used from the Intel based systems. You can’t win them all. Lets see how long it takes until mobile versions with Zen 3 architecture are released.
My software is available here.
